Cloud Dashboard Reporting
The Cloud Dashboard provides a comprehensive view of business performance, offering actionable insights and key metrics to drive growth.
Key Features of the Cloud Dashboard
1. Variance Indicators
- Purpose: Assess performance compared to the same period last year.
- Performance Indicators:
- Red: 5% Below last year’s result.
- Orange: Within 5% improvement of last year.
- Green: Exceeding last year’s performance by 5% or more.

2. Top 10 Key Performance Indicators (KPIs)
Sales Metrics
- Net Sales: Total sales value after discounts, excluding gift certificates and prepayments.
- Average $/Ticket: Sales divided by the number of tickets.
- Tickets: Count of transactions involving products, services, or fees.
Customer Insights
- Visits: Unique customer transactions per day.
- New Customer Visits: First-time customer visits (excludes walk-ins).
- Rebooking Rate: Percentage of service customers who rebooked before leaving.
Service & Retail Metrics
- Service Sales: Total value of service transactions after discounts.
- Retail Sales: Total retail value after discounts.
- Retail Conversion Rate: Percentage of service visitors who purchased retail items.
Upselling Metrics
- Upsells: The amount of up sold retail, additional services or other items sold along with an appointment. Services are considered upsold if they were added directly into the point of sale, or to the appointment book on the day of an appointment that had been booked on a previous day. .
- Service Upsells: Added services during an appointment.
- Retail Upsells: Retail items added to service transactions.

3. Visual Reporting Tools
Sales Trends
- Tracks completed and pre-booked sales for a selected period, offering projections for upcoming sales.
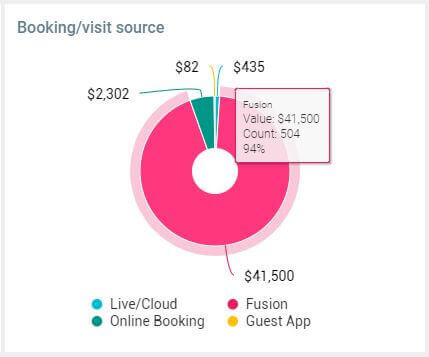
Booking/Visit Source
- Displays booking origins (e.g., Cloud Appointment Book, Google) with insights on booking value and volume.

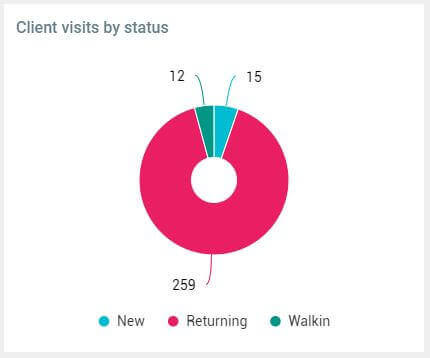
Client Visit Status
- Categorises visits into walk-ins, new, and returning customers for clearer customer segmentation.

4. Employee Performance Metrics
- Sales: Net sales attributed to individual employees.
- Average $/Ticket: Employee-specific ticket averages.
- Rebooking Rate: Automated calculation of rebooked services.
- Service & Retail Sales: Performance in both service and retail sales.

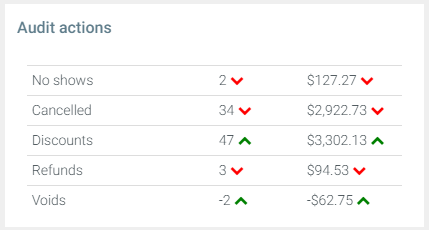
5. Audit Actions
A summary of key management areas:
- No-shows: Count and value of missed appointments.
- Cancellations: Count and value of canceled appointments.
- Discounts: Value of discounts applied.
- Refunds: Total refunds processed.

Important Note
- Figures are net of discounts unless otherwise stated.
%20(1300%20x%20200%20px).png?width=450&height=69&name=Short%20Haircut%20Photo%20Banner%20Email%20Header%20(1300%20x%20300%20px)%20(1300%20x%20200%20px).png)